Primary Fermented Base
Record working volume, culture / ingredient basis, actual residence and product release. Calendar occupancy matters more than the maximum vessel filling rate.
Evaluate fermentation scheduling, temperature control, transfer, packaging and sanitation without assuming shorter fermentation automatically increases profitable output.
Discuss Your Project
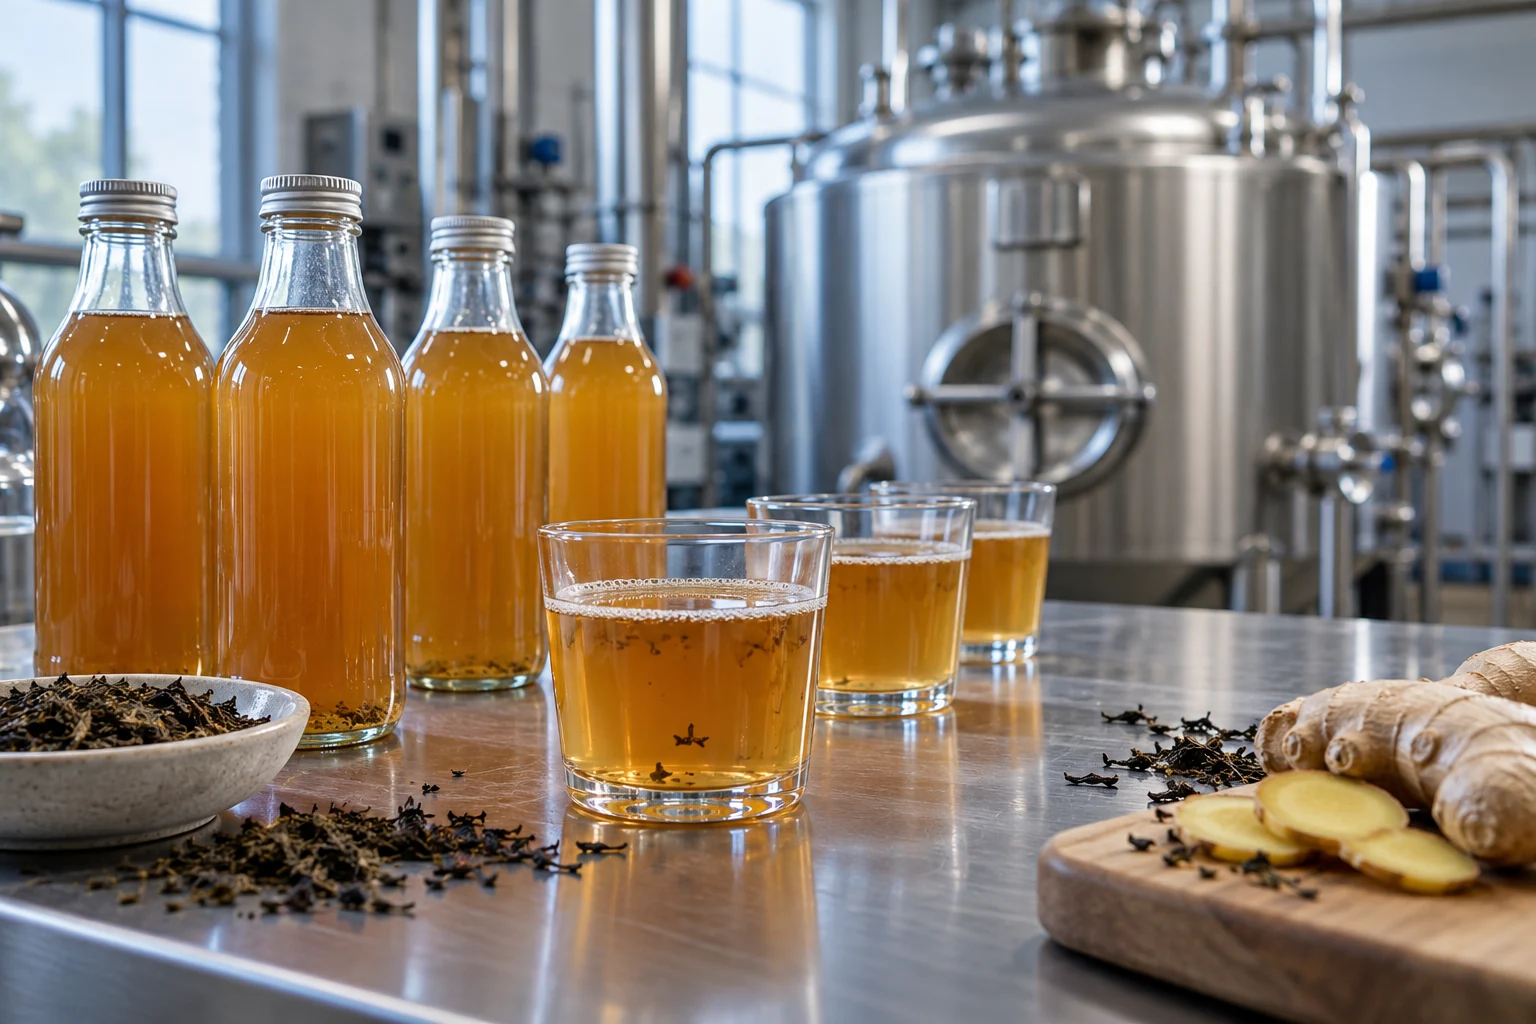
Record working volume, culture / ingredient basis, actual residence and product release. Calendar occupancy matters more than the maximum vessel filling rate.
Fruit, botanicals and other additions may affect solids, further activity, transfer, flavor carryover and cleaning. Verify the intended package and storage behavior through the qualified product process.
Do not assume a tea fermentation process transfers to every grain, fruit or dairy culture. Clarify the product category, ingredient and preservation / packaging basis before evaluating shared equipment.
Build a product-matched tank occupancy and release calendar, including filling, residence, transfer and cleaning.
Coordinate ingredient additions, product identity, solids / gas behavior and package interfaces.
Meter the existing installed circuits and cold duty while preserving the qualified sanitation basis.
Review each system by its operating duty and the interfaces to be agreed before procurement.
Product-specific fermentation and holding schedule.
Temperature-control and cleaning supply.
Qualified tank / transfer cleaning interfaces.
Specialist treatment, filtration and filling.
Swipe horizontally to compare all columns ↔
| System | Operating duty | Relevant DPS guide | Confirm before purchase |
|---|---|---|---|
| Configured tanks / vessels | Product-specific fermentation and holding schedule. | DPS tanks & vessels ↗ | Working duty, fittings, cleaning and process ownership. |
| Process utilities and distribution | Temperature-control and cleaning supply. | Utility infrastructure planning ↗ | Actual delivered conditions and simultaneous duties. |
| CIP equipment and circuit interfaces | Qualified tank / transfer cleaning interfaces. | DPS CIP systems ↗ | Manual tasks, returns and verification. |
| Specialist equipment interfaces | Specialist treatment, filtration and filling. | Installation & integration ↗ | Product-specific acceptance and storage / package behavior. |
Compare tank working duty and installed sanitary routes with the actual qualified product and occupancy schedule. A proposed throughput benefit must be supported by more accepted packages, not a shortened fermentation assumed only to justify equipment. Keep product-specific testing and supplier responsibilities visible in the tender.
Swipe horizontally to compare all columns ↔
| Buying question | Evidence to prepare | Engineering decision |
|---|---|---|
| Can residence be shortened? | Qualified product trials and release / storage evidence. | Product specialists decide feasibility before capital benefits. |
| Do more vessels fit the operation? | Occupancy, utilities, cleaning and package demand. | Compare a complete usable calendar. |
| What changes for a new flavor? | Ingredient, solids, activity and cleaning / package assessment. | Define the actual additional equipment or procedure scope. |
Start with the business outcome
A kombucha producer’s capacity question is often the interaction between qualified fermentation, tank occupancy, flavor additions, cold holding and packaging. DPS can help coordinate vessels, utilities, transfer, controls and installation around that operating basis. A credible upgrade values accepted product and actual resource costs while the qualified product team determines fermentation, alcohol / acidity control and release.
Live cultures, continued fermentation, alcohol / acidity measurement, shelf-life and food-safety release require qualified product-specific assessment. No universal fermentation duration, culture condition or allowable product parameter is prescribed. Specialist filtration, treatment and packaging duties require explicit OEM scope.
Document working volumes, ingredient and culture basis, qualified residence, release conditions and the production calendar for the actual beverage.
Verify utility delivery, temperature control, flavor or solids handling and the selected package interfaces through representative products.
Review installed cleaning circuits, release records, transfer losses and good packaged quantity without assuming shorter fermentation creates additional sales.
Review the scope, cost assumptions and operating case for your project. The examples and calculators below support early planning and are not DPS quotations.
Gather tank occupancy, qualified release, cold-duty and package-state data across representative recipes. Compare utility / control / route improvements before adding or enlarging vessels.
Define the qualified product / fermentation / storage basis, expected residence, flavor family, package and realistic demand. Coordinate utilities, hygiene, ingredients and specialist packages.
Swipe horizontally to compare all columns ↔
| Observed condition | Measure before design | DPS / team decision | Economic basis |
|---|---|---|---|
| Long occupied tank time | Qualified process / release and calendar data. | Compare vessels, schedule and actual process constraints. | Only feasible accepted output with demand. |
| Unstable temperature control | Product / utility logs and ambient conditions. | Correct source, distribution or control where verified. | Measured baseline energy; product quality separately accepted. |
| Flavor / solids transfer loss | Accepted input-output and product-change records. | Review routing and specialist interfaces. | Actual avoided baseline inputs or additional contribution once. |
| Cleaning resource use | Metered water, chemistry and heat by circuit. | Review installed return and sequence. | Purchased resource reductions after added service cost. |
Swipe horizontally to compare all columns ↔
| Decision | Targeted Work | Broader Scope |
|---|---|---|
| Tank Availability | Improve the qualified schedule and release coordination. | Add vessels when required residence still limits the calendar. |
| Temperature Control | Correct measured source, distribution or control gaps. | Expand cooling against actual product and ambient-duty records. |
| Flavor Campaigns | Improve solids transfer and cleaning sequence. | Add flexibility only for qualified product and package combinations. |
Compare proposals with the same product duty, supplier boundaries and acceptance basis. The amount below is a transparent planning example, not a market price range, supplier estimate or DPS quotation.
| Cost bucket | Assumed amount |
|---|---|
| Product / process and interface engineering | $27,000 |
| Defined configured / OEM component allowance | $95,000 |
| Mechanical / electrical field installation | $52,000 |
| Instrumentation and control integration | $27,000 |
| Commissioning and acceptance support | $16,000 |
| Training, documentation and closeout | $8,000 |
| Defined project scope | $225,000 |
| Separate site / facility additions | $35,000 |
| Capital contingency (15%) | $39,000 |
| Separate one-time startup / shutdown cost | $25,000 |
| Incremental working capital | $15,000 |
| Total initial cash | $339,000 |
The defined scope assumes applicable freight, procurement charges and taxes are included in the owner’s estimate. Add missing civil, land / shell, OEM, environmental, validation and permitting costs explicitly. Site and field conditions, duty, production access and quoted supplier scope determine actual price. Financing is excluded.
Hypothetical owner-budget case: This conservative utility / integration case assumes no incremental product sales; productive time, good-output rate and demand are all zero. Product quantity alone does not establish a profitable output gain. The baseline inputs assume $28,000 energy, $14,000 water / chemistry and $5,000 maintenance reductions per year. Avoided payroll is 300 hours × $38 × 50% cash realization. Verified baseline purchase reduction contributes $0; its basis is unchanged accepted baseline output. Deduct $10,000 added annual fixed cost. Result: $42,700 steady net benefit; initial cash $339,000 includes the separate site, contingency, startup and working-capital inputs. These are original illustrative assumptions, not a quotation, price benchmark or achieved DPS result.
Calculated from these assumptions: steady annual net benefit $42,700; year-one net cash $32,160; cash payback Beyond 5 years; five-year NPV at 10% is −$186,715. Change the assumptions below to test a different case.
Replace the illustrative inputs with your own measured or quoted values. The five-year pre-tax model uses good kilograms, demand-capped contribution and separately verified baseline savings; it is not a project quotation.
All defaults are illustrative. The default case is an operating-plant improvement, not a greenfield quote. For a new operation, set baseline savings to zero and enter every additional operating and capital cost.
Includes contingency, startup and working capital
Incremental operating cash before tax
Includes year-one ramp assumption
At 10% annual discount
Net annual benefit ÷ initial cash
Net cumulative gain ÷ initial cash
Modeled incremental sales: 0 kg/year at $0.00/kg contribution. The base case does not recover the required discounted return within five years. Year-one net cash: $32,160.
Realization needed for the target operating payback
Not feasible
Demand, time, contribution or other cash benefits cannot meet the 5-year target under these assumptions.
CSV export is local. No inputs are submitted.
Swipe the chart to compare all five years ↔
Swipe horizontally to compare all columns ↔
| Year | Net cash | Cumulative cash | Discounted cash |
|---|---|---|---|
| Initial | −$339,000 | −$339,000 | −$339,000 |
| Year 1 | $32,160 | −$306,840 | $29,236 |
| Year 2 | $42,700 | −$264,140 | $35,289 |
| Year 3 | $42,700 | −$221,440 | $32,081 |
| Year 4 | $42,700 | −$178,740 | $29,165 |
| Year 5 | $42,700 | −$136,040 | $26,513 |
Swipe horizontally to compare all columns ↔
| Case | Annual benefit | NPV | Cash payback |
|---|---|---|---|
| Downside | $42,700 | −$246,515 | Beyond 5 years |
| Base | $42,700 | −$186,715 | Beyond 5 years |
| Upside | $42,700 | −$186,715 | Beyond 5 years |
Downside: installed and site costs +20%, realization ×0.75 and unit contribution reduced by 20% of its absolute value. Upside: realization ×1.15, capped at 100%, and unit contribution improved by 10% of its absolute value. The demand ceiling still applies.
The default reproduces the main retrofit energy input of $28,000/year before added maintenance. The narrow worksheet is not a product-process calculation and does not automatically transfer values into the ROI model. Additional annual service is included in the main added-fixed-cost allowance; deduct it once.
Prepare the information below, export the assumptions you have modeled, and discuss the unknowns with DPS. An unmeasured input is a question to resolve, not a reason to invent precision.
Checklist and model data stay in this browser until you choose to share them.
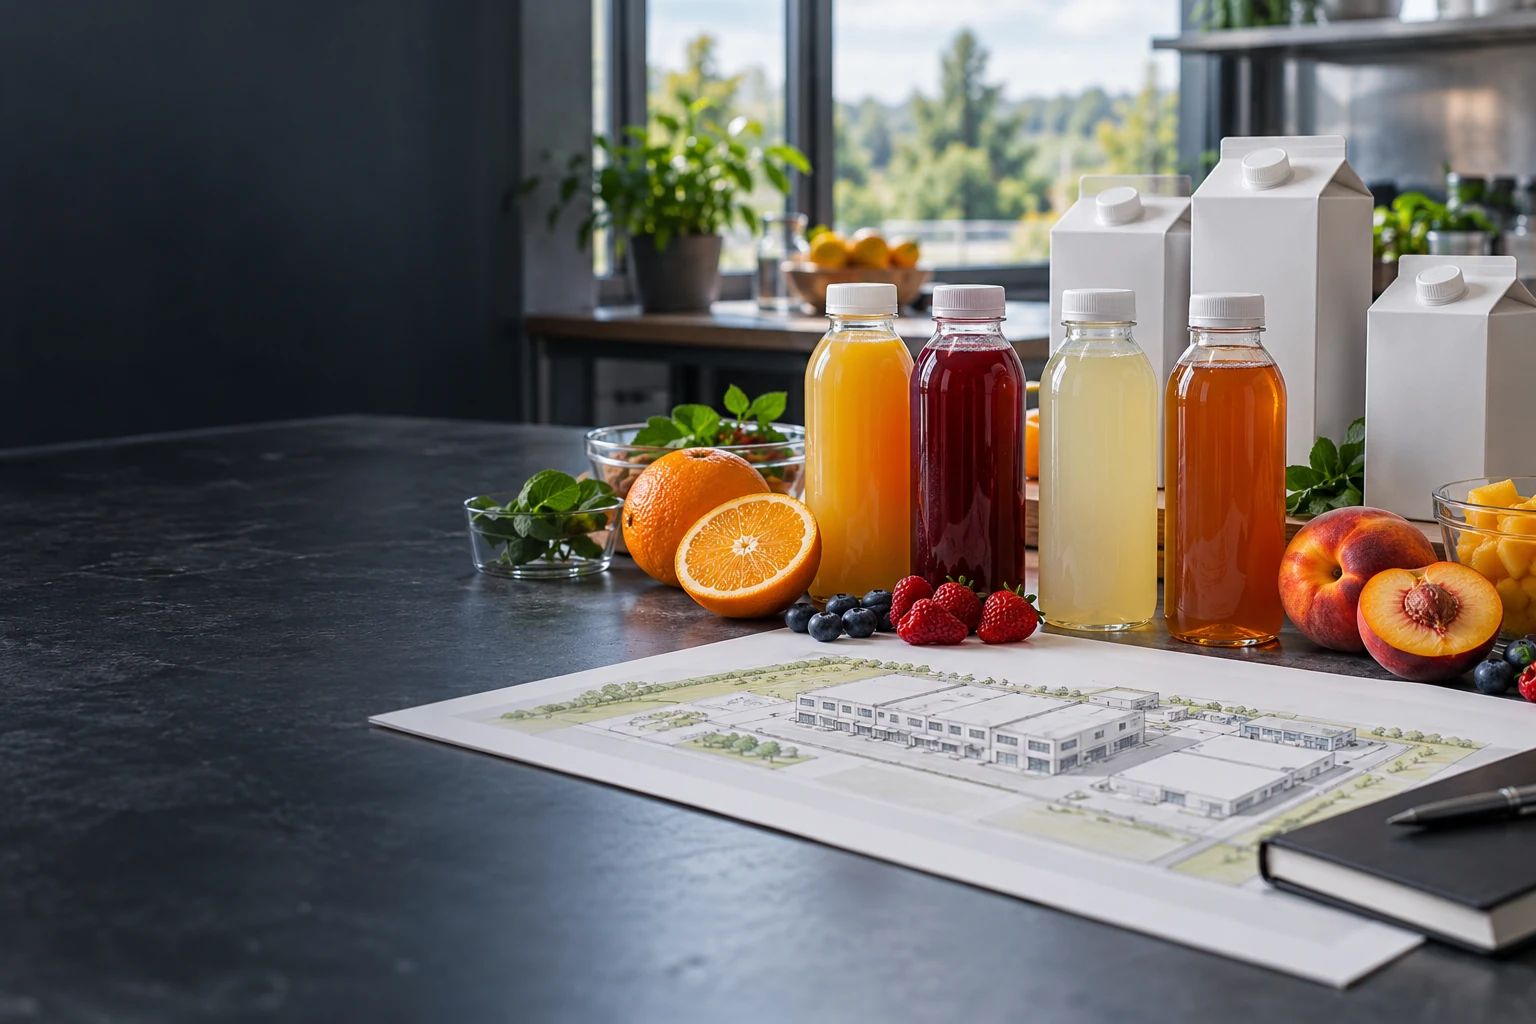
Compare aseptic and hot-fill beverage concepts through product suitability, packaging, hygienic boundaries, utilities and the complete capital scope.
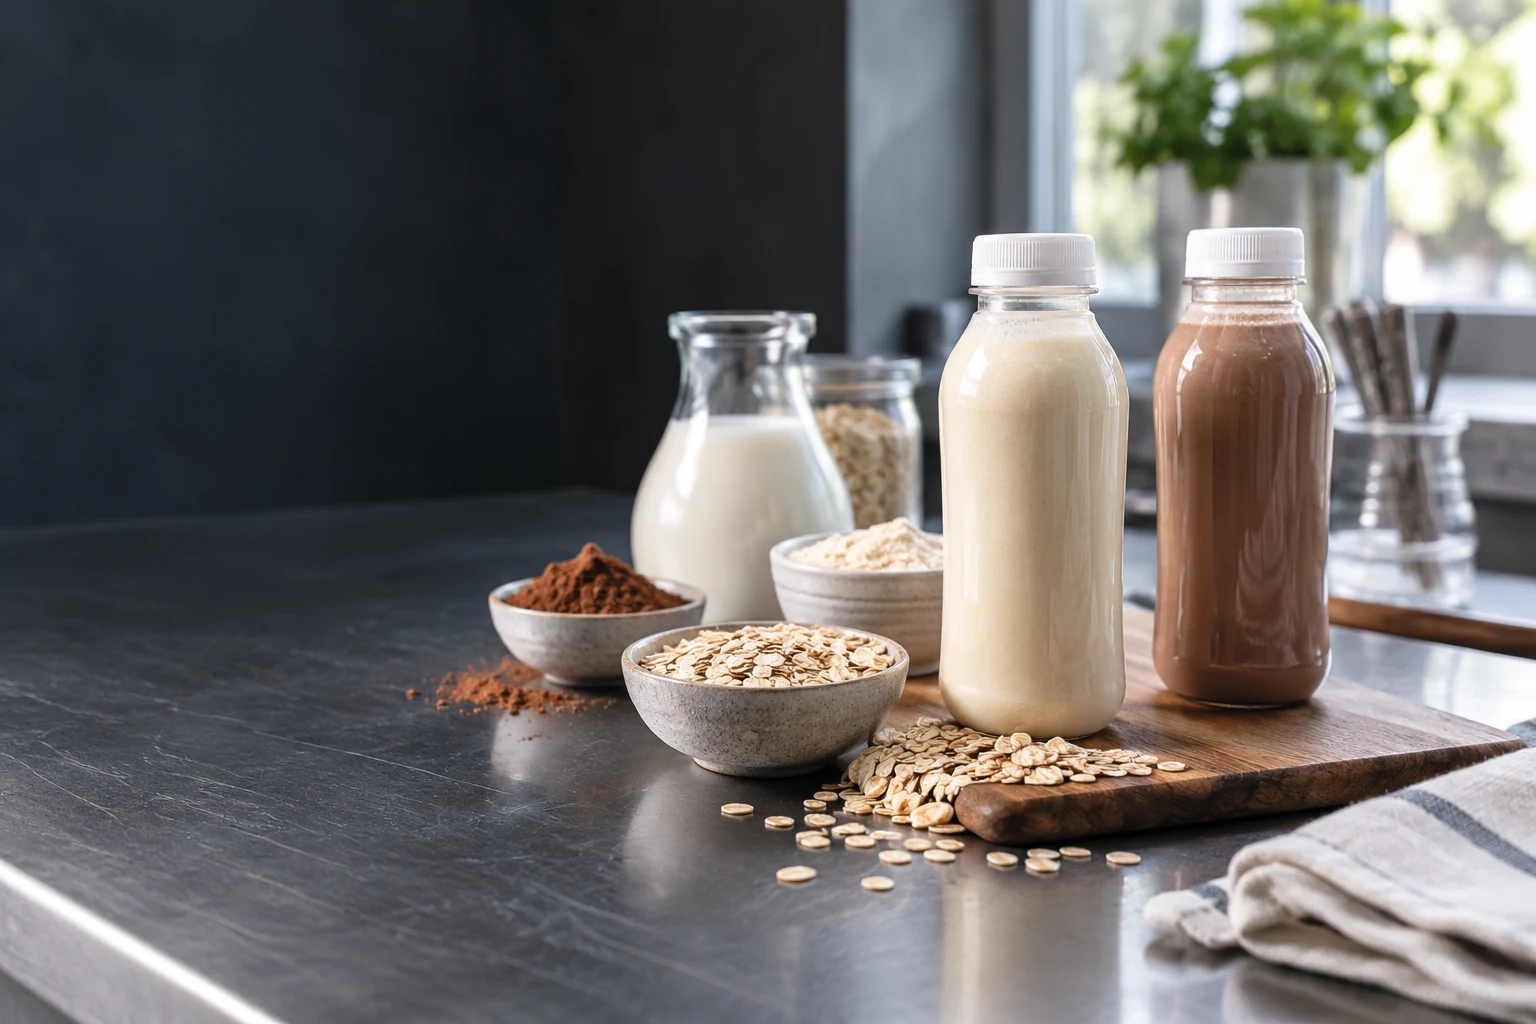
Plan RTD protein beverage manufacturing around formulation, ingredient route, process trials, preservation, packaging and a coordinated factory scope.
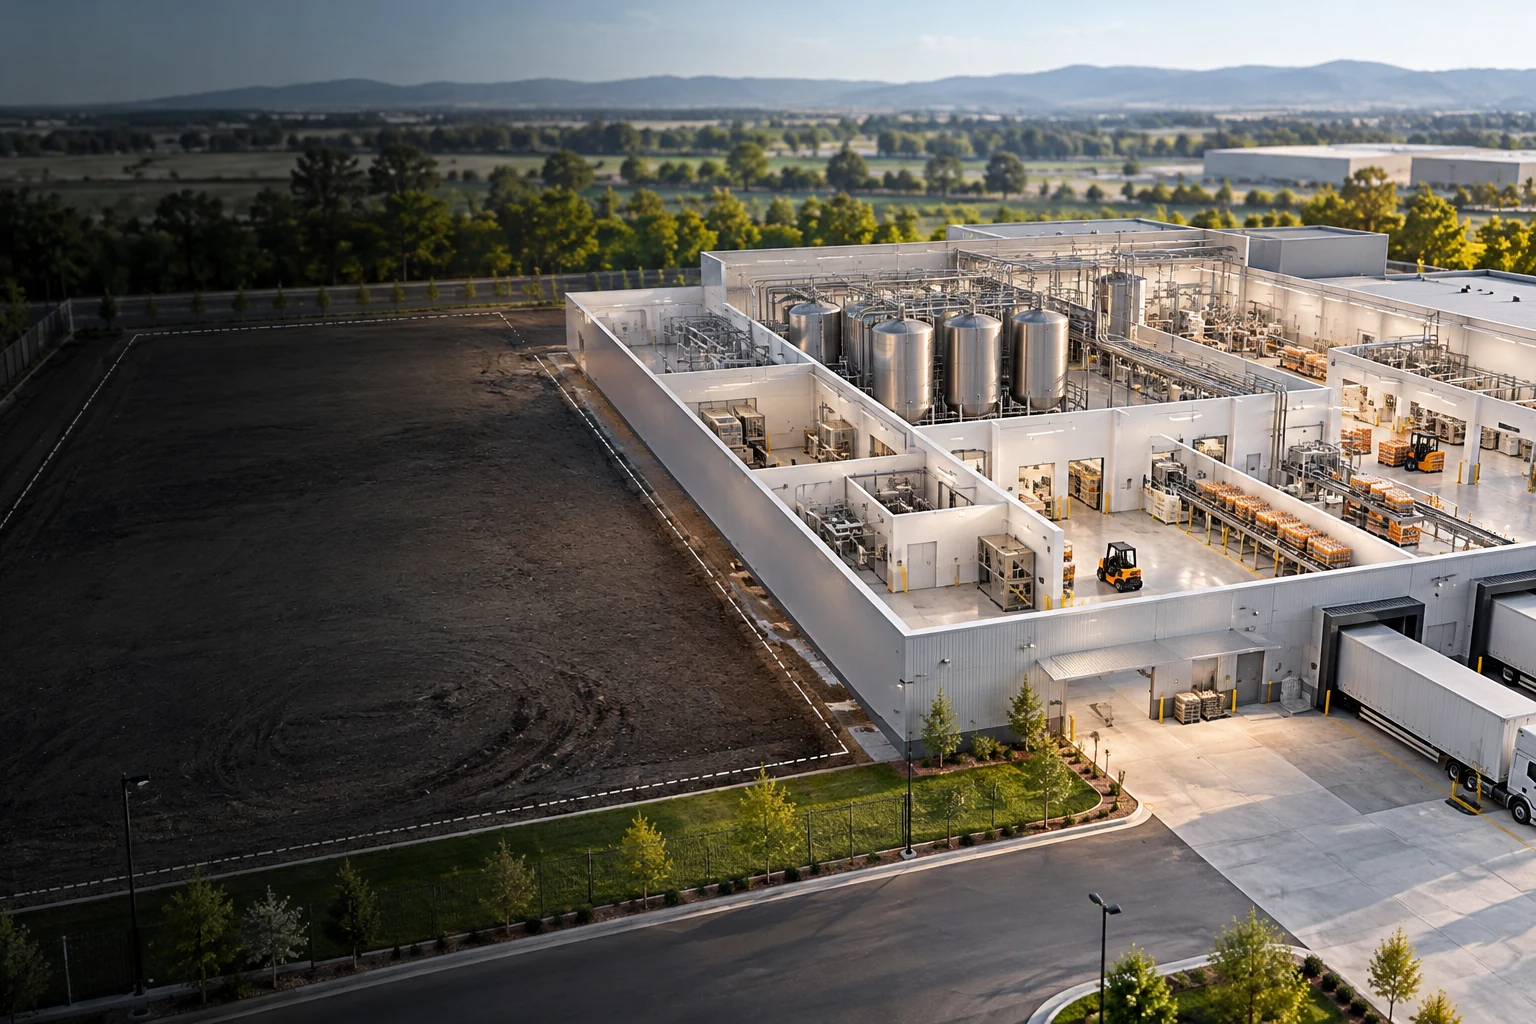
Plan beverage phase two around mix preparation, vessels, cleaning, utilities and access, with clear first-build provisions and investment triggers.
Bring your product requirements, operating priorities and site constraints to an initial scope discussion with DPS.