Batch process variability
Record actual loading, processing, cooling, discharge and cleaning distributions by recipe. Averages can hide the specific shortfall that repeatedly starves packaging.
Coordinate batch completion, product-approved holding, transfer, filler capacity and cleaning before adding another buffer tank or cooker.
Start with the business outcome
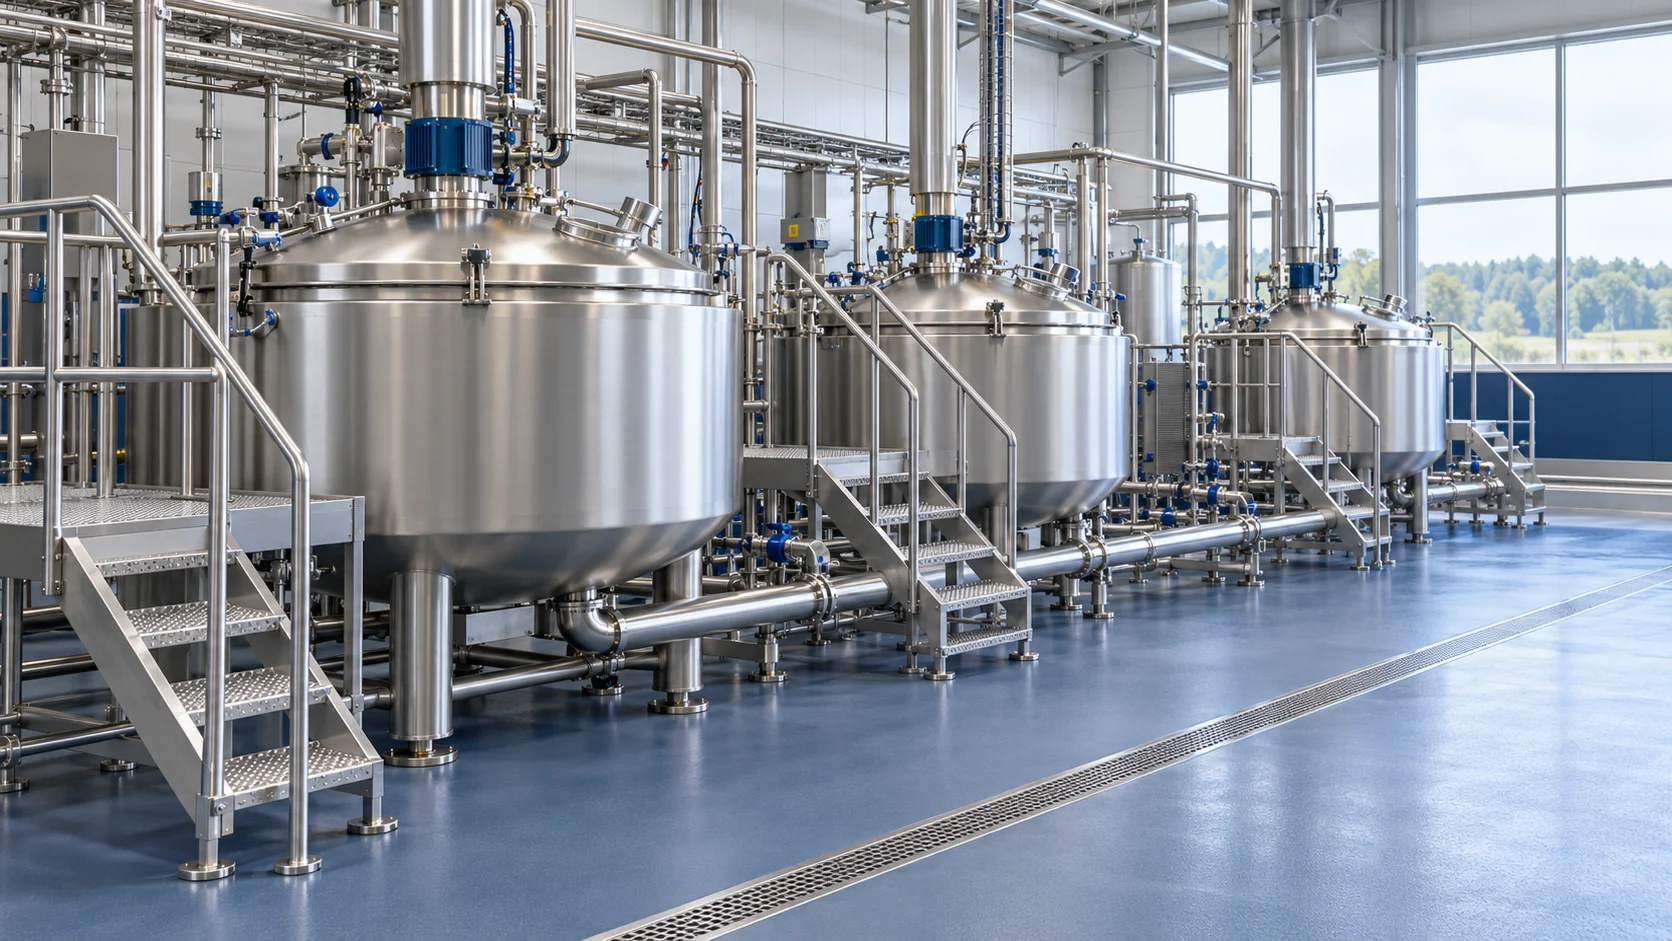
A filler can be starved while the batch room appears busy, or a finished batch can wait behind packaging. DPS can connect the process calendar, vessels, transfer, utilities and OEM control handshakes. The useful improvement is accepted packed output within the actual schedule, not another isolated machine rate or more work in progress.
The qualified product team defines permitted holds, agitation, temperature, residence and release. Filler / packaging OEMs define package performance and interfaces. Buffer capacity does not itself establish a safe or suitable product hold.
Record actual loading, processing, cooling, discharge and cleaning distributions by recipe. Averages can hide the specific shortfall that repeatedly starves packaging.
Use real good-output performance by format, startup, changeover and downtime. Nameplate containers/hour must be converted consistently to accepted product mass or another agreed financial unit.
Define product-approved residence, mixing, temperature, cleaning and usable volume. More storage can increase working capital and conceal an unresolved constraint.
Align actual batch completion and filler demand with staffing and qualified holds.
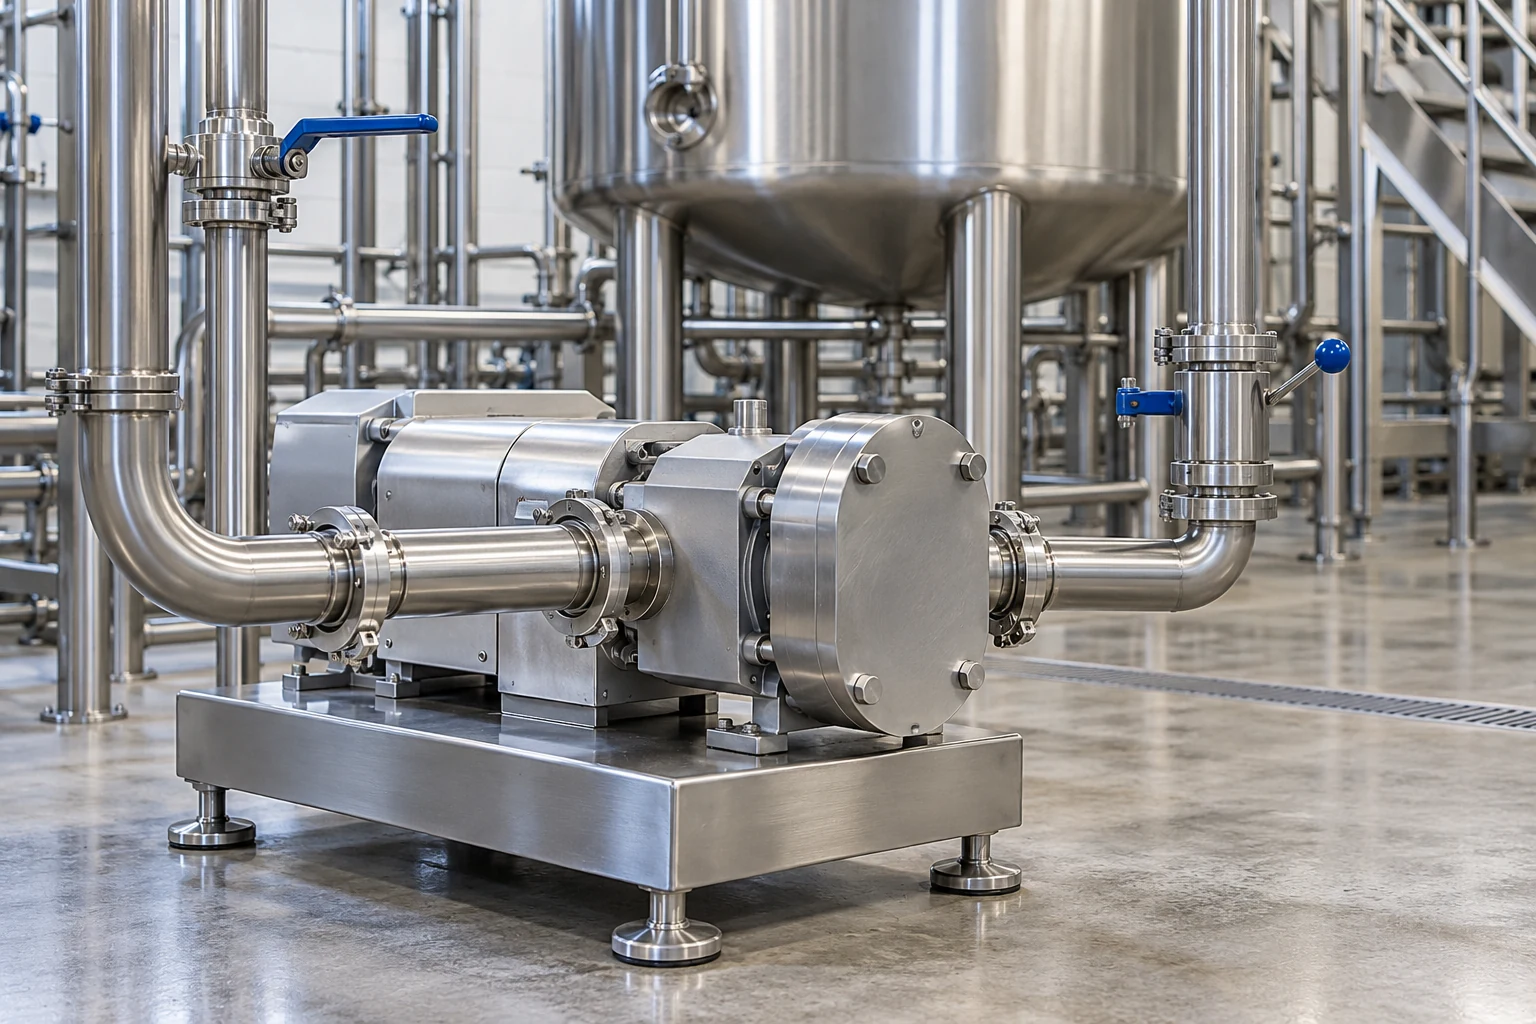
Compare working volume and transfer duty with product residence and cleaning requirements.
Compare upstream and downstream additions after lower-capital corrections.
Swipe horizontally to compare all columns ↔
| System | Operating duty | Relevant DPS guide | Confirm before purchase |
|---|---|---|---|
| Process engineering | Turn measured requirements into an interface and duty specification. | Process engineering ↗ | Actual product envelope, baseline data, qualified trials and responsibilities. |
| Configured process vessels | Provide the specified working volume, mixing / holding and connections. | Tanks and vessels ↗ | Working duty, material, agitation, residence, cleaning and access. |
| Transfer / filler interface | Connect the process to the specialist packaging package. | Installation & integration ↗ | Product-approved hold, OEM rates, state handshakes and package tests. |
| Instrumentation and controls | Execute the agreed sequence and record meaningful equipment states. | Automation & controls ↗ | I/O, alarms, recipe authority, backups and acceptance tests. |
Compare the actual upstream / downstream calendar on one accepted-output basis.
Swipe horizontally to compare all columns ↔
| Decision | What to compare | Acceptance evidence |
|---|---|---|
| Buffer | Allowed residence, working volume and arrival variability | No inappropriate product hold; useful filler availability. |
| Cycle correction | Complete process / transfer / cleaning window | An additional accepted batch or actual avoided cost. |
| Filler addition | Package / product rates, supply and shared services | Whole-train accepted packs and realistic sales demand. |
Swipe horizontally to compare all columns ↔
| Observed condition | Measure before design | DPS / team decision | Economic basis |
|---|---|---|---|
| Filler starvation | Synchronize batch / transfer / filler logs. | Correct the verified supply gap. | Demand-supported extra packed good output. |
| Batch room blocking | Record packaging access and holds. | Compare sequence and buffer conditions. | Useful output rather than stored intermediate mass. |
| Transfer mismatch | Measure actual product discharge. | Match pump / valve / filler interface. | Complete batches within the usable window. |
| Excess work in progress | Track residence, inventory and release. | Right-size approved buffers. | Actual working-capital and operating consequences. |
Use synchronized actual state logs to distinguish long process cycles, transfer restrictions, filler performance and schedule conflicts. Trial feasible sequence changes before adding storage.
Model batch sizes, full cycles, approved holds, package mix and utility / cleaning overlap together. Include buffer inventory and the complete supplier control boundary.
Compare proposals with the same product duty, supplier boundaries and acceptance basis. The amount below is a transparent planning example, not a market price range, supplier estimate or DPS quotation.
| Cost bucket | Assumed amount |
|---|---|
| Application engineering and supplier duty review | $34,000 |
| Defined equipment / instrumentation components | $120,000 |
| Mechanical and electrical field installation | $62,000 |
| Controls and interface development | $36,000 |
| Commissioning / agreed acceptance support | $17,000 |
| Training, documentation and handover | $11,000 |
| Defined project scope | $280,000 |
| Separate site / facility additions | $35,000 |
| Capital contingency (15%) | $47,250 |
| Separate one-time startup / shutdown cost | $25,000 |
| Incremental working capital | $20,000 |
| Total initial cash | $407,250 |
The defined scope assumes applicable freight, procurement charges and taxes are included in the owner’s estimate. Add missing civil, land / shell, OEM, environmental, validation and permitting costs explicitly. Site and field conditions, duty, production access and quoted supplier scope determine actual price. Financing is excluded.
Hypothetical screening case: 250 days × 0.5 equivalent useful hour/day × 1,500 accepted kg/h × 65% realization, capped at 100,000 kg incremental demand, gives 100,000 additional sold kg/year. Net price $3.8/kg less incremental variable cost $2.5/kg gives $1.3/kg contribution. Verified baseline purchase savings are $0, realized payroll savings $0, energy $5,000, cleaning resources $6,000 and maintenance $4,000 per year. Deduct $12,000 additional annual fixed cost. The physical case releases one complete 750 kg batch/day, equivalent to 0.5 modeled hour at 1,500 kg/h. After 65% realization the potential 121,875 kg is capped at 100,000 kg incremental demand.
Calculated from these assumptions: steady annual net benefit $133,000; year-one net cash $82,250; cash payback 3.44 years; five-year NPV at 10% is $50,788. Change the assumptions below to test a different case.
Replace the illustrative inputs with your own measured or quoted values. The five-year pre-tax model uses good kilograms, demand-capped contribution and separately verified baseline savings; it is not a project quotation.
All defaults are illustrative. The default case is an operating-plant improvement, not a greenfield quote. For a new operation, set baseline savings to zero and enter every additional operating and capital cost.
Includes contingency, startup and working capital
Incremental operating cash before tax
Includes year-one ramp assumption
At 10% annual discount
Net annual benefit ÷ initial cash
Net cumulative gain ÷ initial cash
Modeled incremental sales: 100,000 kg/year at $1.30/kg contribution. The demand ceiling limits sales. The base case has a nonnegative five-year NPV at the selected discount rate. Year-one net cash: $82,250.
Realization needed for the target operating payback
45.0%
Minimum capacity realization for a 4-year operating cash payback; terminal recovery excluded. Demand and unit margin must also hold.
CSV export is local. No inputs are submitted.
Swipe the chart to compare all five years ↔
Swipe horizontally to compare all columns ↔
| Year | Net cash | Cumulative cash | Discounted cash |
|---|---|---|---|
| Initial | −$407,250 | −$407,250 | −$407,250 |
| Year 1 | $82,250 | −$325,000 | $74,773 |
| Year 2 | $133,000 | −$192,000 | $109,917 |
| Year 3 | $133,000 | −$59,000 | $99,925 |
| Year 4 | $133,000 | $74,000 | $90,841 |
| Year 5 | $133,000 | $207,000 | $82,583 |
Swipe horizontally to compare all columns ↔
| Case | Annual benefit | NPV | Cash payback |
|---|---|---|---|
| Downside | $98,063 | −$142,986 | Beyond 5 years |
| Base | $133,000 | $50,788 | 3.44 years |
| Upside | $146,000 | $95,932 | 3.17 years |
Downside: installed and site costs +20%, realization ×0.75 and unit contribution reduced by 20% of its absolute value. Upside: realization ×1.15, capped at 100%, and unit contribution improved by 10% of its absolute value. The demand ceiling still applies.
Initial cash = (defined project scope + site additions) × (1 + contingency) + separate startup / shutdown cost + working capital. Contingency is conservatively treated as spent initially.
Sold incremental kg = min(days × recovered hours/day × constrained good kg/hour × realization, incremental demand). Contribution = sold incremental kg × (net price − incremental variable cost). New-volume labor, energy and packaging belong in that variable cost.
Baseline material benefit uses the verified percentage of actual purchases avoided at unchanged accepted baseline output. It is not a direct subtraction of two loss rates. Count a recovered kilogram once, either as its applicable cash saving or as incremental contribution.
Net annual benefit = contribution + independently realized baseline cash savings − added fixed operating cost. Year one scales gross benefits by the ramp factor while paying the full added fixed operating cost. Do not also count the same launch loss in the one-time startup amount.
Cash ROI = net annual benefit / initial cash. Five-year net ROI = (five-year cash inflows − initial cash) / initial cash. NPV = −initial cash + Σ cash flow(t)/(1 + discount rate)^t. Payback uses annual cash with linear interpolation within the recovery year. The threshold solver excludes terminal working-capital recovery.
This is a five-year screening horizon, not an asset’s entire life. No tax, debt, depreciation, grants, escalation, asset resale or additional replacement capital is modeled. Include recurring service costs in operating expense and use a detailed monthly budget for formal capital approval.
A 720-minute window fits 4 current vs 5 proposed cycles at 750 accepted kg/batch. This supports the main equivalent capacity basis only when the filler, product-approved hold and commercial schedule can accept the extra batch.
Use representative products, measured constraints and a documented utility / cleaning envelope. Assign each supplier and owner interface.
Plan FAT / SAT, instruments, recipes, permissives, quality checks and upstream / downstream handshakes as appropriate to the scope.
After stabilization, compare matched products and operating conditions. Reconcile extra output with sales, and baseline savings with actual purchases, bills and payroll.
Published scope / project context
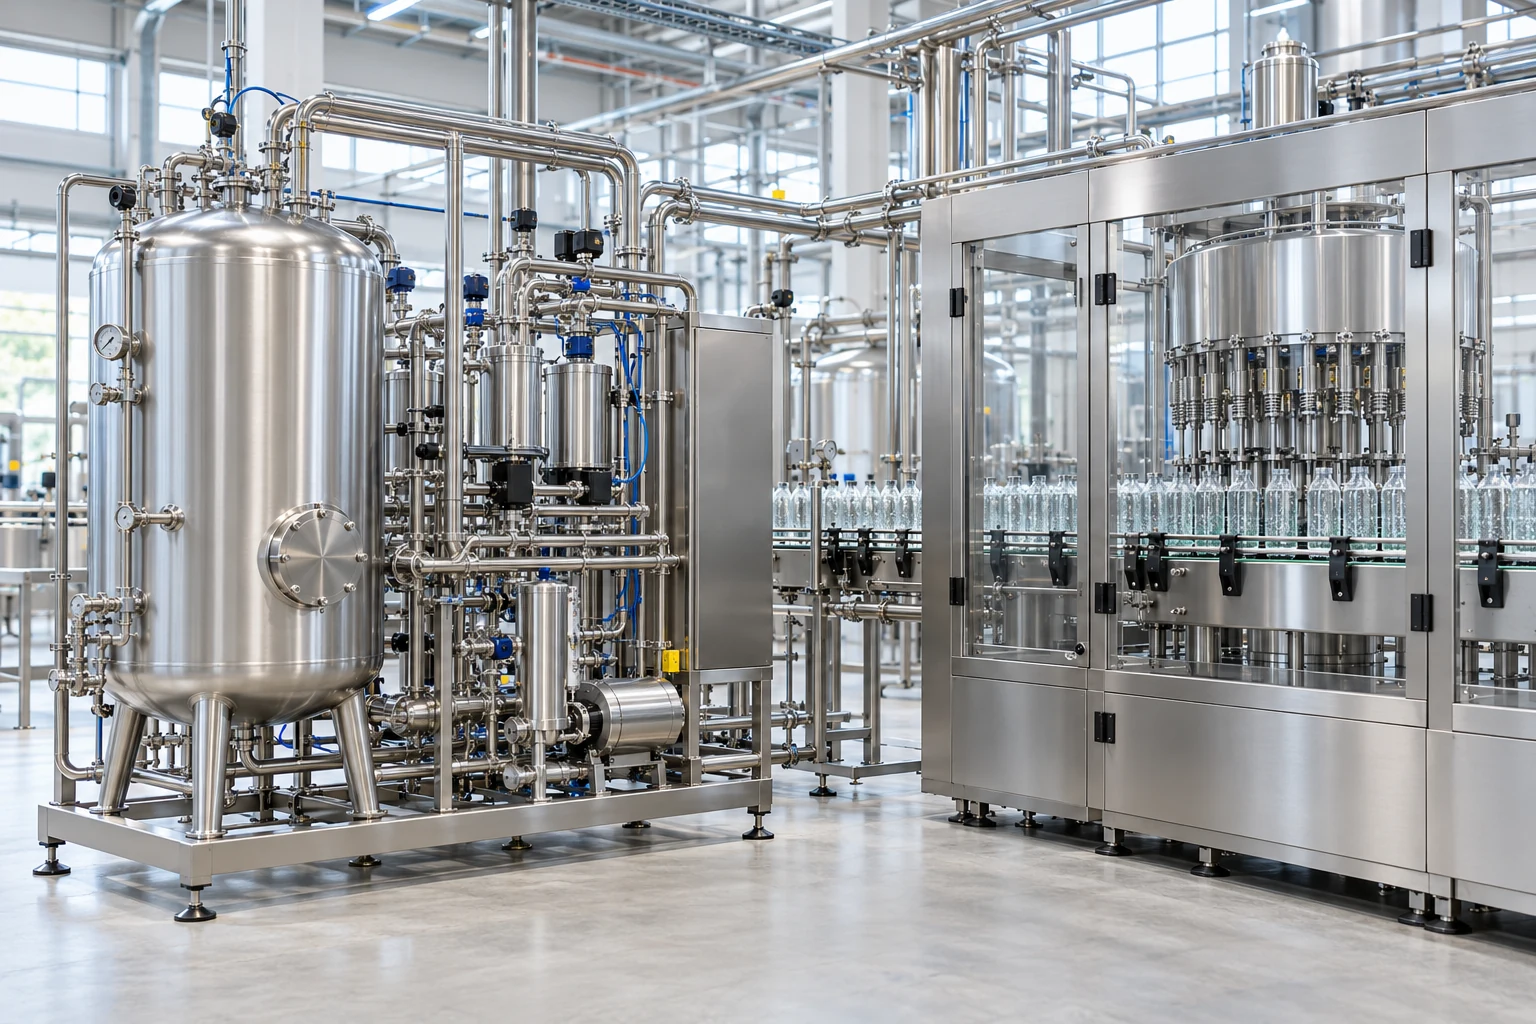
DPS publishes process engineering, configured equipment, controls and installation / integration services. The source links establish relevant scope. The amounts, time changes, resource reductions and returns here are original hypothetical inputs, not achieved DPS customer results.
Swipe horizontally to compare all columns ↔
| Decision | Targeted intervention | Broader replacement / new operation |
|---|---|---|
| Constraint | A measured gap can be corrected within retained assets. | The verified operating envelope cannot meet product, demand or reliability needs. |
| Cost scope | Include engineering, interfaces, shutdown, commissioning and retained-asset risk. | Include all new systems, site / facility work, OEMs, utilities, ramp and working capital. |
| Benefit | Only incremental contribution and genuinely avoided costs versus the current operation. | Demand-supported contribution less the full additional operating cost versus the agreed alternative. |
| Acceptance | Verify the changed duty and its effect on the complete line. | Verify the integrated new train and the owner’s readiness to operate. |
Prepare the information below, export the assumptions you have modeled, and discuss the unknowns with DPS. An unmeasured input is a question to resolve, not a reason to invent precision.
Checklist and model data stay in this browser until you choose to share them.
DPS describes operating modes, recipe authority, instrumentation, OEM interfaces, test plans, backups and handover. This supports an integration discussion, not a claim that every software platform, certification or business-system interface is included.
Guide assumptions reviewed on 26 October 2026. Qualified site / product teams establish regulatory and food-safety requirements; this guide does not prescribe a validated process.

Plan food processing and packaging as one path. Compare rates, batch presentation, buffers, interfaces and staged capacity before selecting equipment.
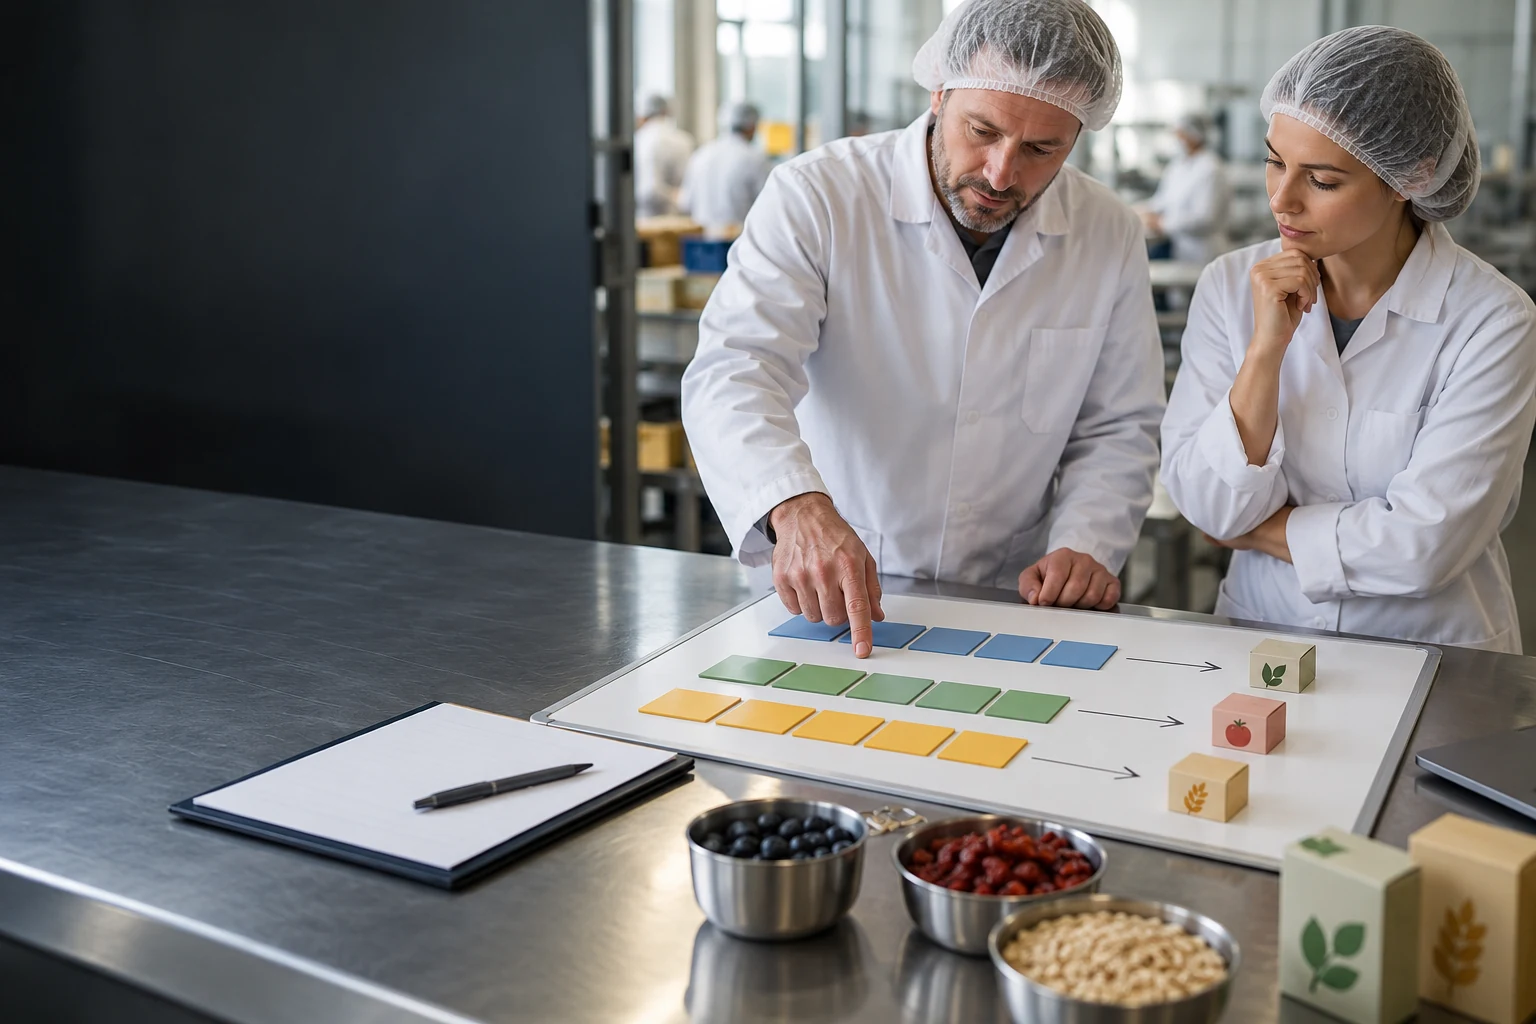
Compare another shift, shorter changeovers and a new line using the actual bottleneck, saleable output, added operating cost and incremental investment.

Translate demand into food plant capacity using product mix, shifts, campaign time, yield and packaging constraints before sizing a new factory.